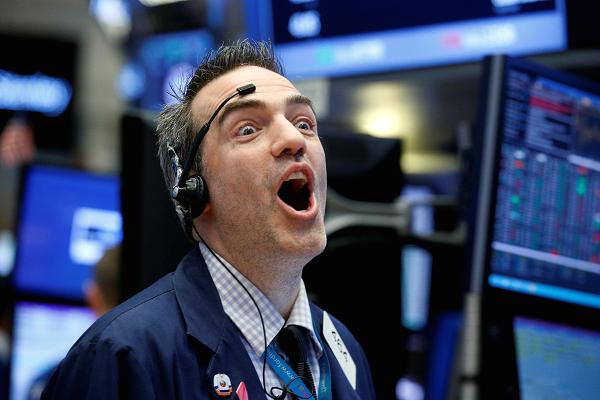
All.Time.Highs!!!! Everyone is cheering on the financial news networks. Truth be told, the excitement for round numbers, like 22,000, is just an artificial construct. If the market closes tomorrow at 22,047, there won’t be a huge new story like this, because the extra “47” ruins the “milestone”.
However, this is the kind of headline that catches the attention of people who aren’t investors. As these headlines keep coming, the novice investor jumps in to buy equities at all-time highs. While nobody (yes, including me) knows where the market will be a year from now, we have ways to measuring current valuations against historical valuations. This can help us to understand that, in relation to earnings, how expensive is the stock market?
(Now, keep in mind, this is the entire stock market as a whole….there are always individual stocks that will be less expensive, and others that are more expensive.)
First, a quick definition: The PE is the price of a company divided by its earnings…so a company that is selling for $20M makes $1M earnings is a 20 PE. If you flip the two, earnings divided by price, you get the return of the investment…so the same example above is $1M / $20M = 5% return. This means, if you bought this company, you make 5%/year on your investment. This means, you will have a $21M company after a year.
Take a look at this link: http://www.multpl.com/shiller-pe/ The stock market is at a 30 PE. The historical average is around 18. To get back to historical norms, earnings have to increase by 66% (they can with a massive corporate tax cut), or stock prices, as a whole, need to drop by about 40%.
When people are cheering, it’s time to wonder if the floor is about to give out on the market at the sign of any bad news.
The Dow Jones industrial average notched another milestone on Wednesday, breaking above 22,000 for the first time.
Source: Dow closes above 22,000 for the first time after Apple jumps on earnings


